

Broad coverage · Continuous monitoring · Ground-focused
Satellite Earth Observation for ground understanding
We turn satellite data into engineering insight — elevation, terrain, surface texture and ground change, mapped over any site or corridor. It extends our geotechnical work upward: the same ground we investigate borehole by borehole, first read from orbit so fieldwork lands where it matters.
Geotechnical applications
Ground and terrain intelligence
Everything in this section serves one purpose: informing ground investigation. Satellite data gives a first read of the same ground we later drill — terrain, water and surface change understood before boreholes, trial pits and field tests are planned.
Terrain analysis
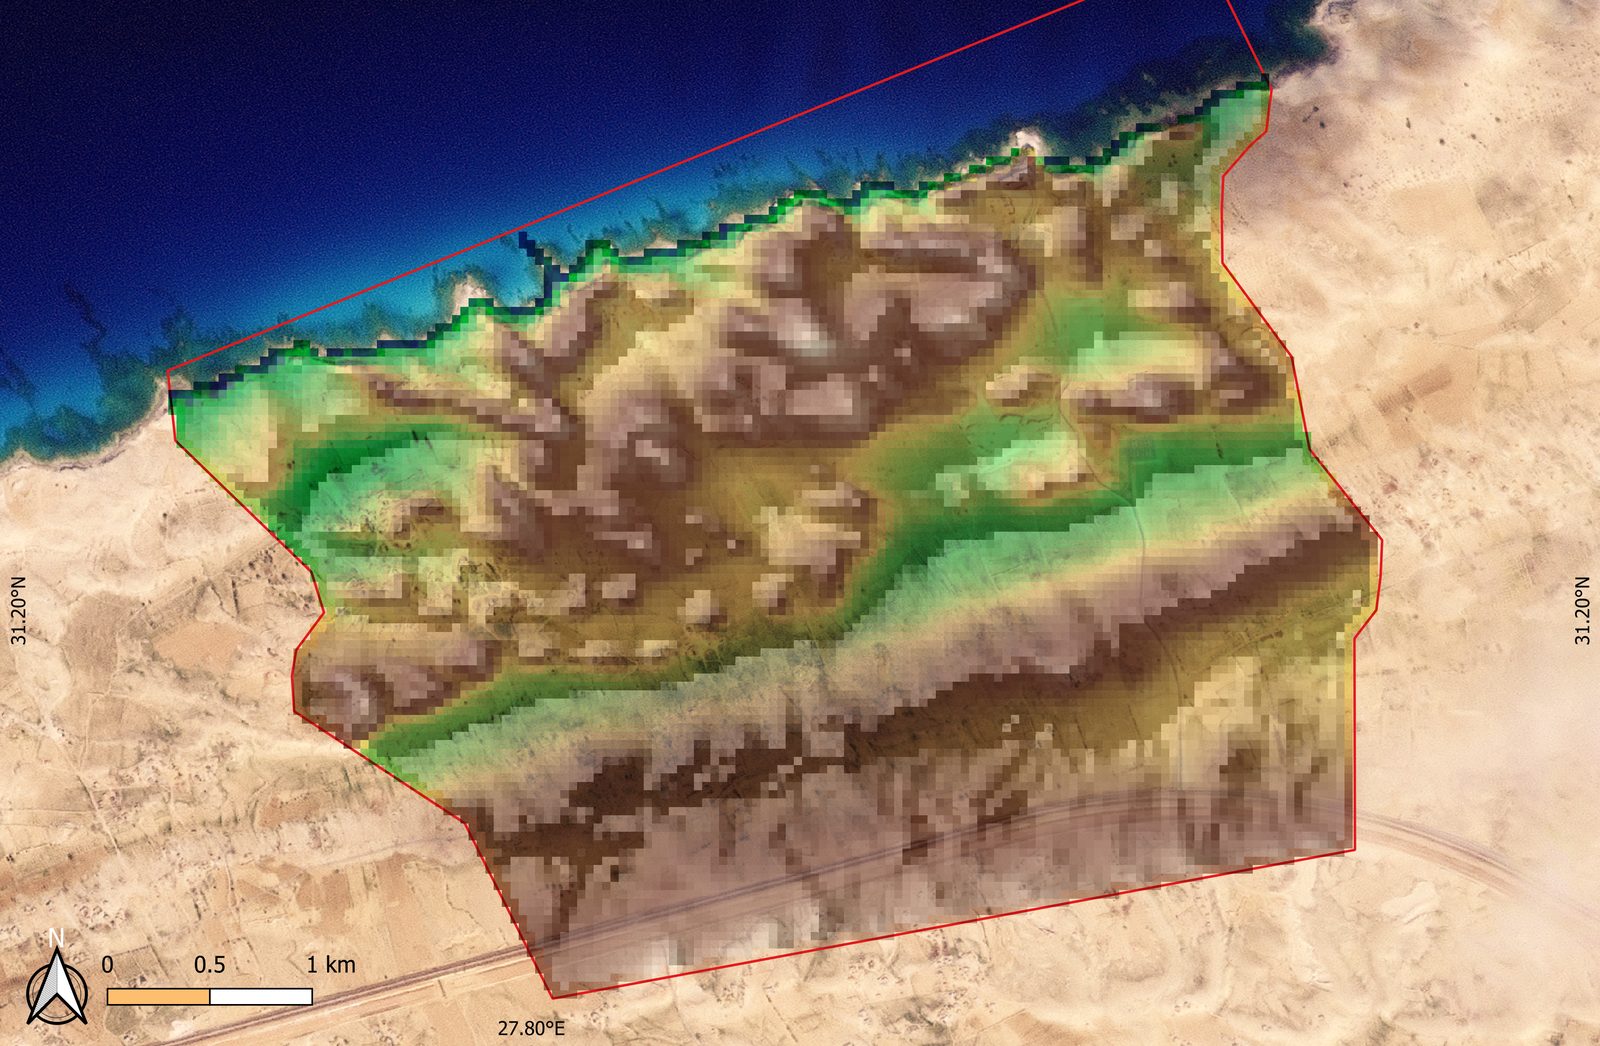
Terrain products are derived from the Copernicus DEM at 30 m resolution, produced under the EU Copernicus programme from radar satellite data and photogrammetry. Together they inform drainage, slope stability and development suitability — particularly in coastal zones, where gradients are subtle and runoff paths matter.
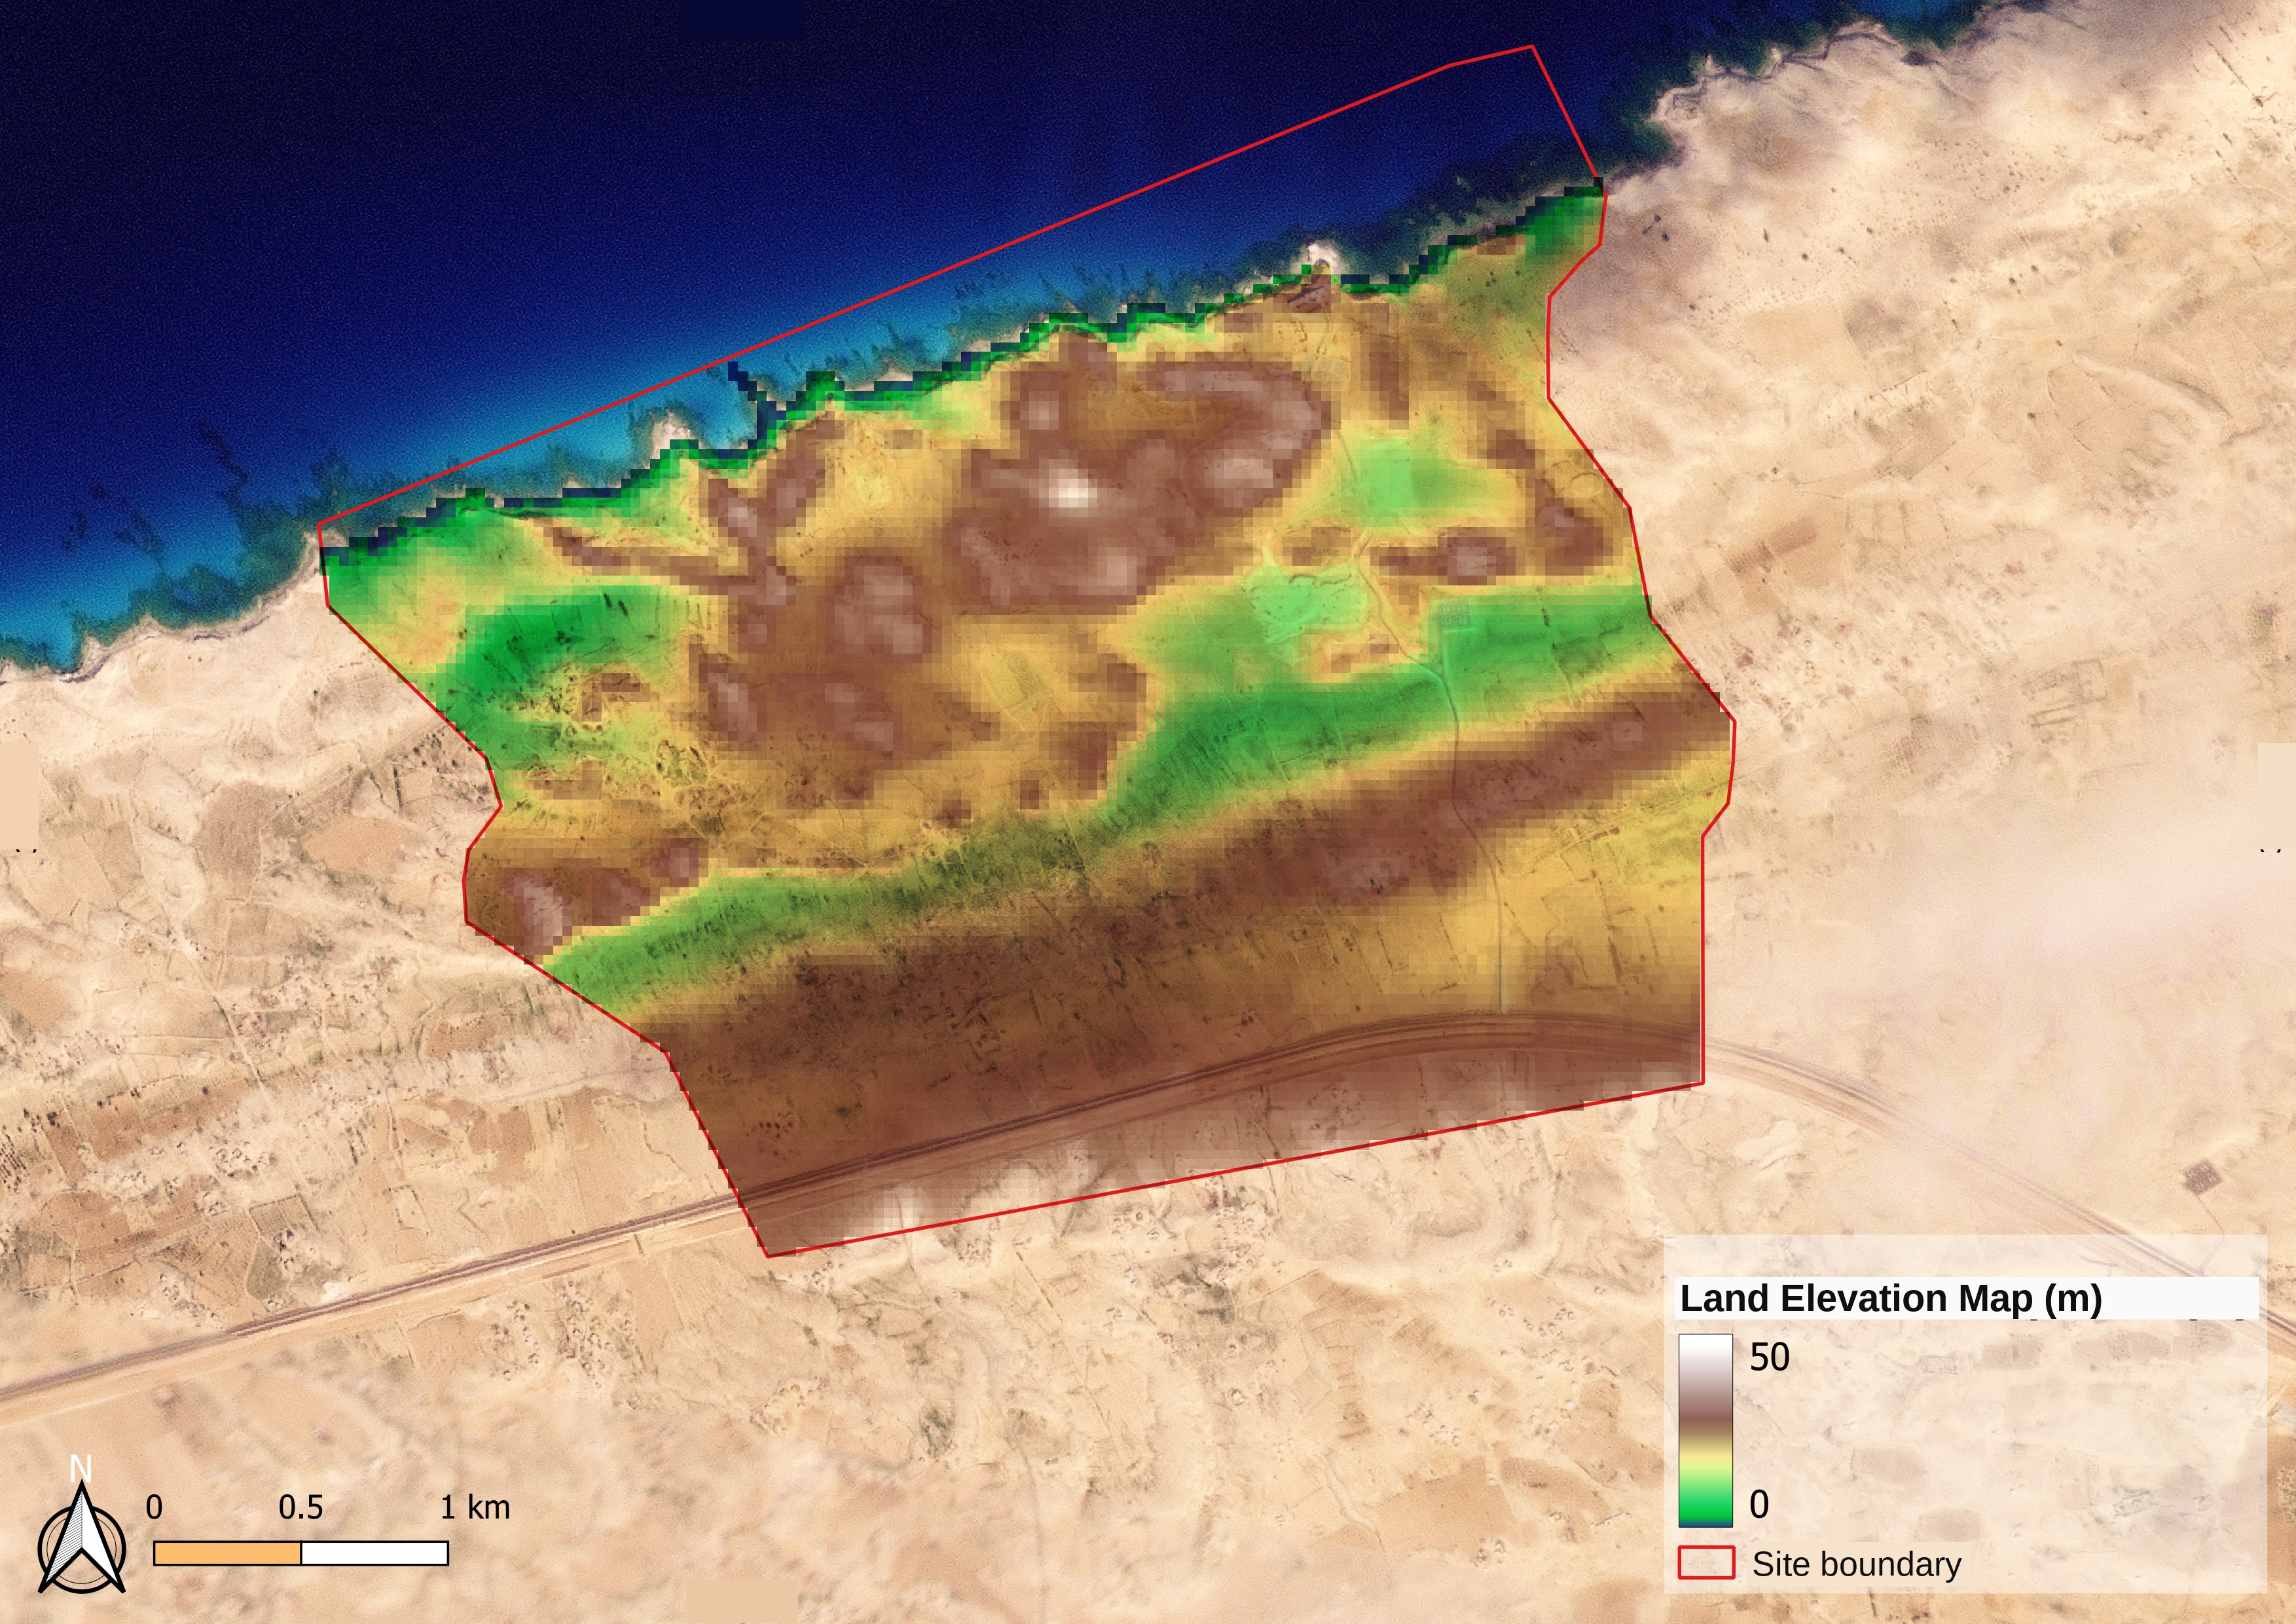
Land elevation
Extracted directly from the digital elevation model raster.
Baseline heights for drainage, earthworks and platform levels.
Shaded relief
Simulated illumination of the surface from a chosen azimuth and altitude.
Reveals ridges, channels and subtle landforms for visual interpretation.
Slope
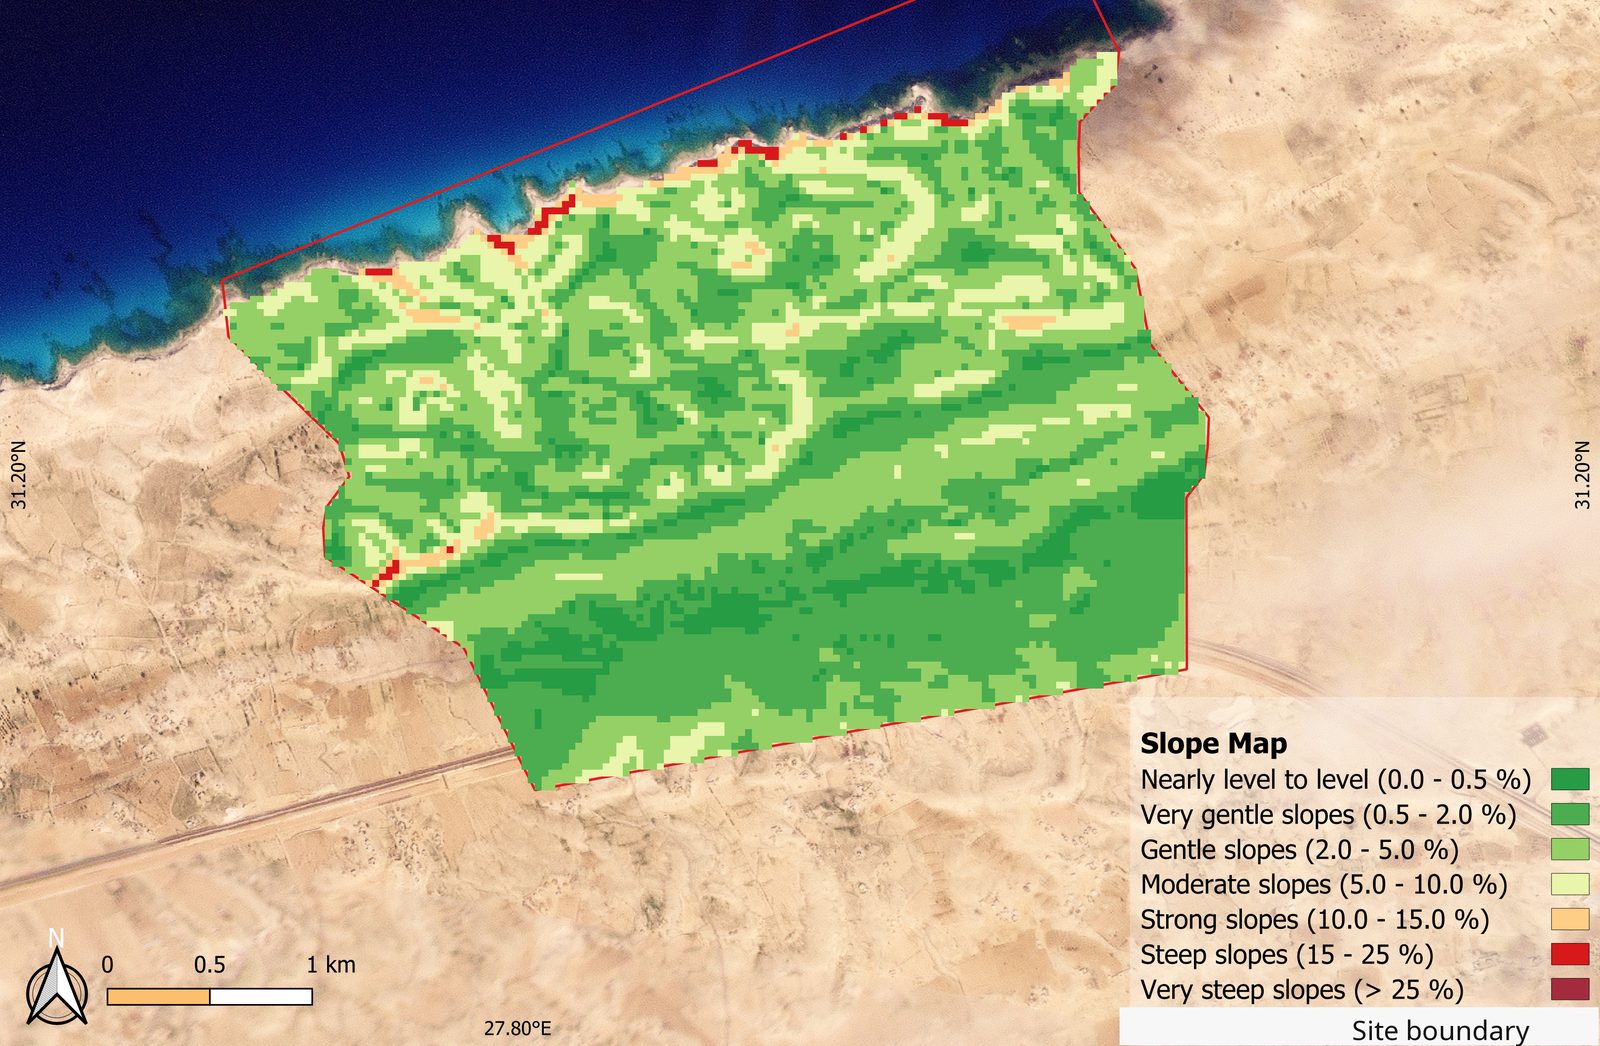
Elevation differences between neighbouring pixels — rise over run, expressed as a percentage and classified from nearly level to very steep.
Slope stability, cut-and-fill volumes and development suitability.
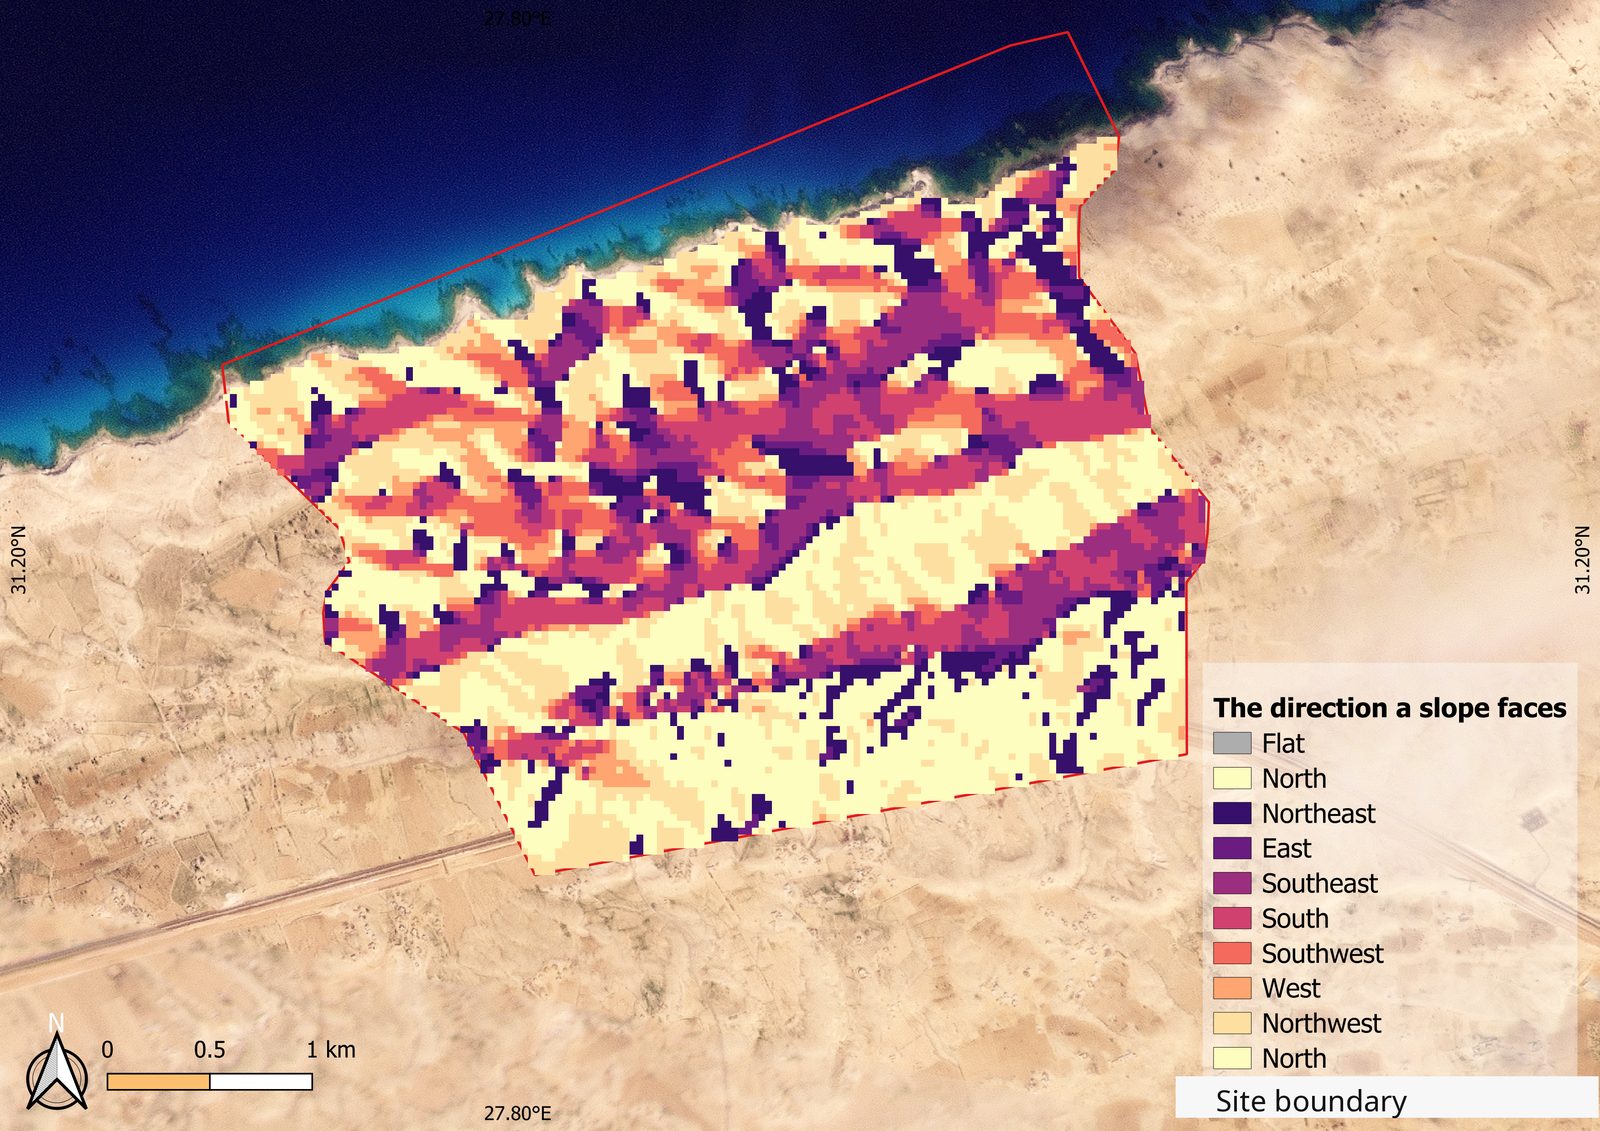
Aspect
The compass direction a slope faces, from 0° to 360° measured from north.
Runoff direction, exposure and micro-climate along coastal margins.
Hydrological & catchment analysis
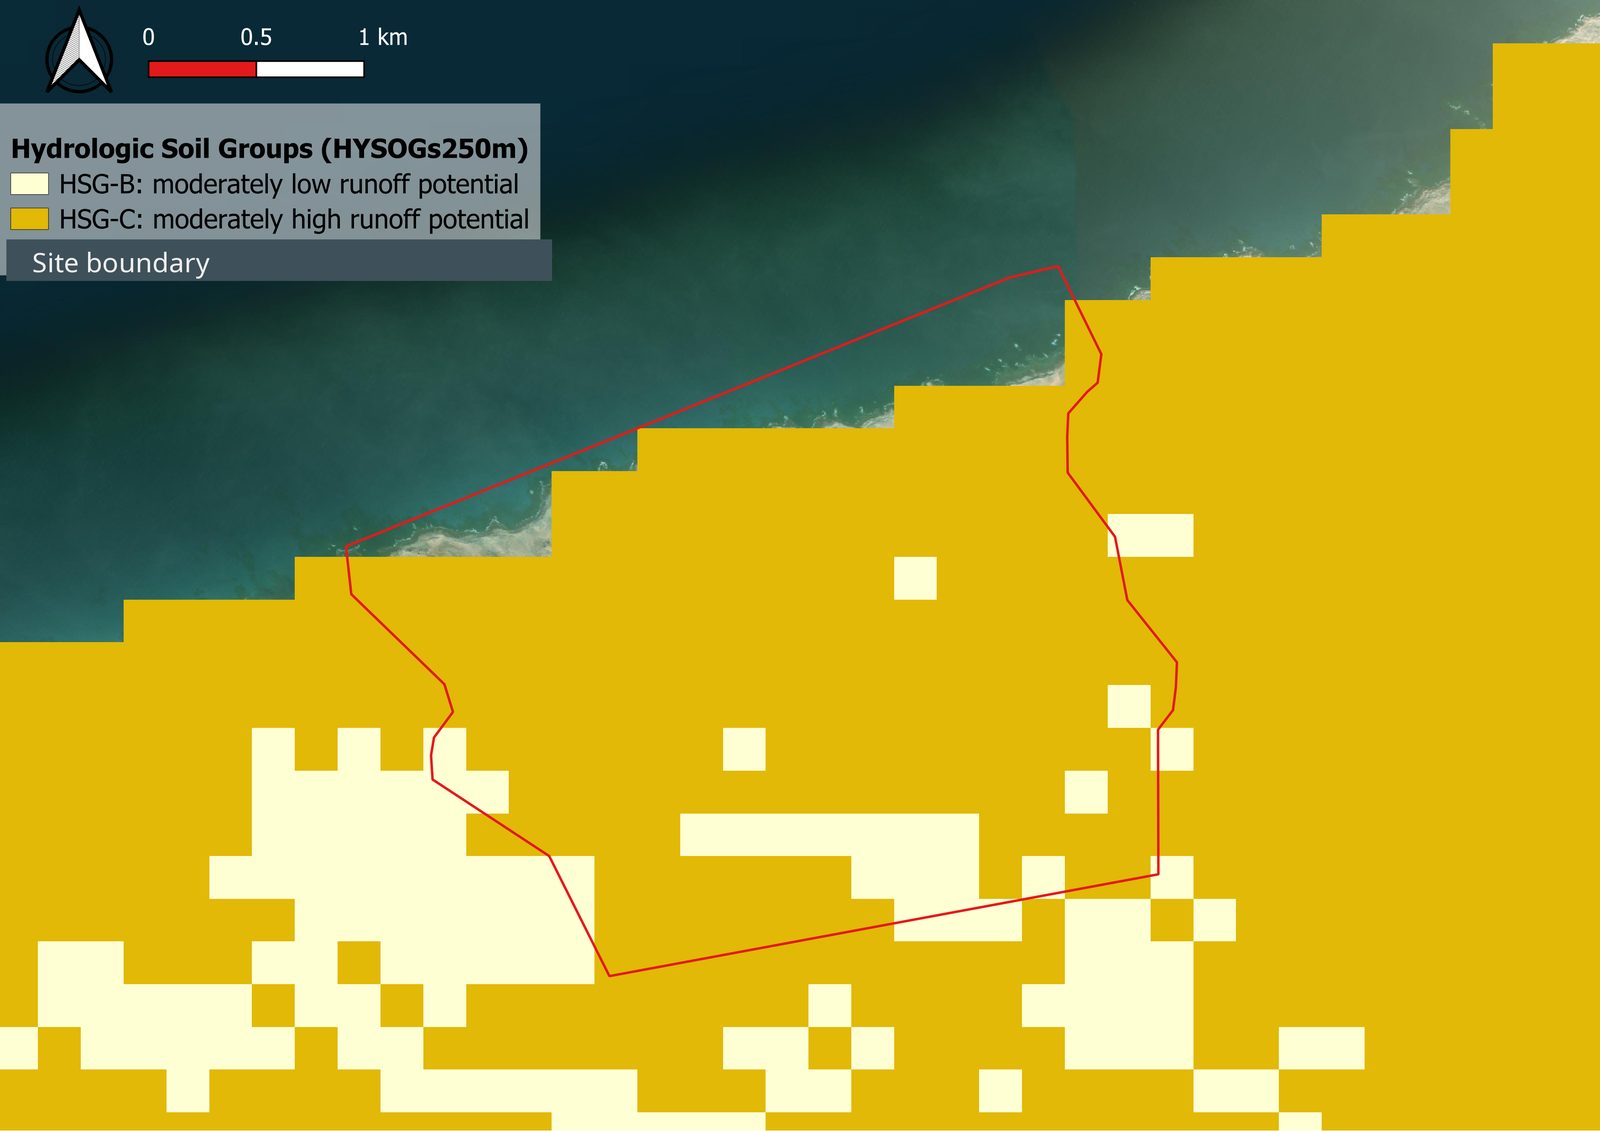
Flow paths, wadis, catchment boundaries and ponding areas traced from elevation data — showing where water runs, gathers and erodes across a site before drainage and earthworks are designed.
Ground condition & surface change
Surface character classified from multispectral imagery — rock, sand, sabkha, made ground — with repeat passes compared over time to detect excavation, filling, reclamation and erosion: dated, repeatable evidence of what changed and where.
Geospatial data services
Investigation data, spatially managed
GIS-based borehole data management
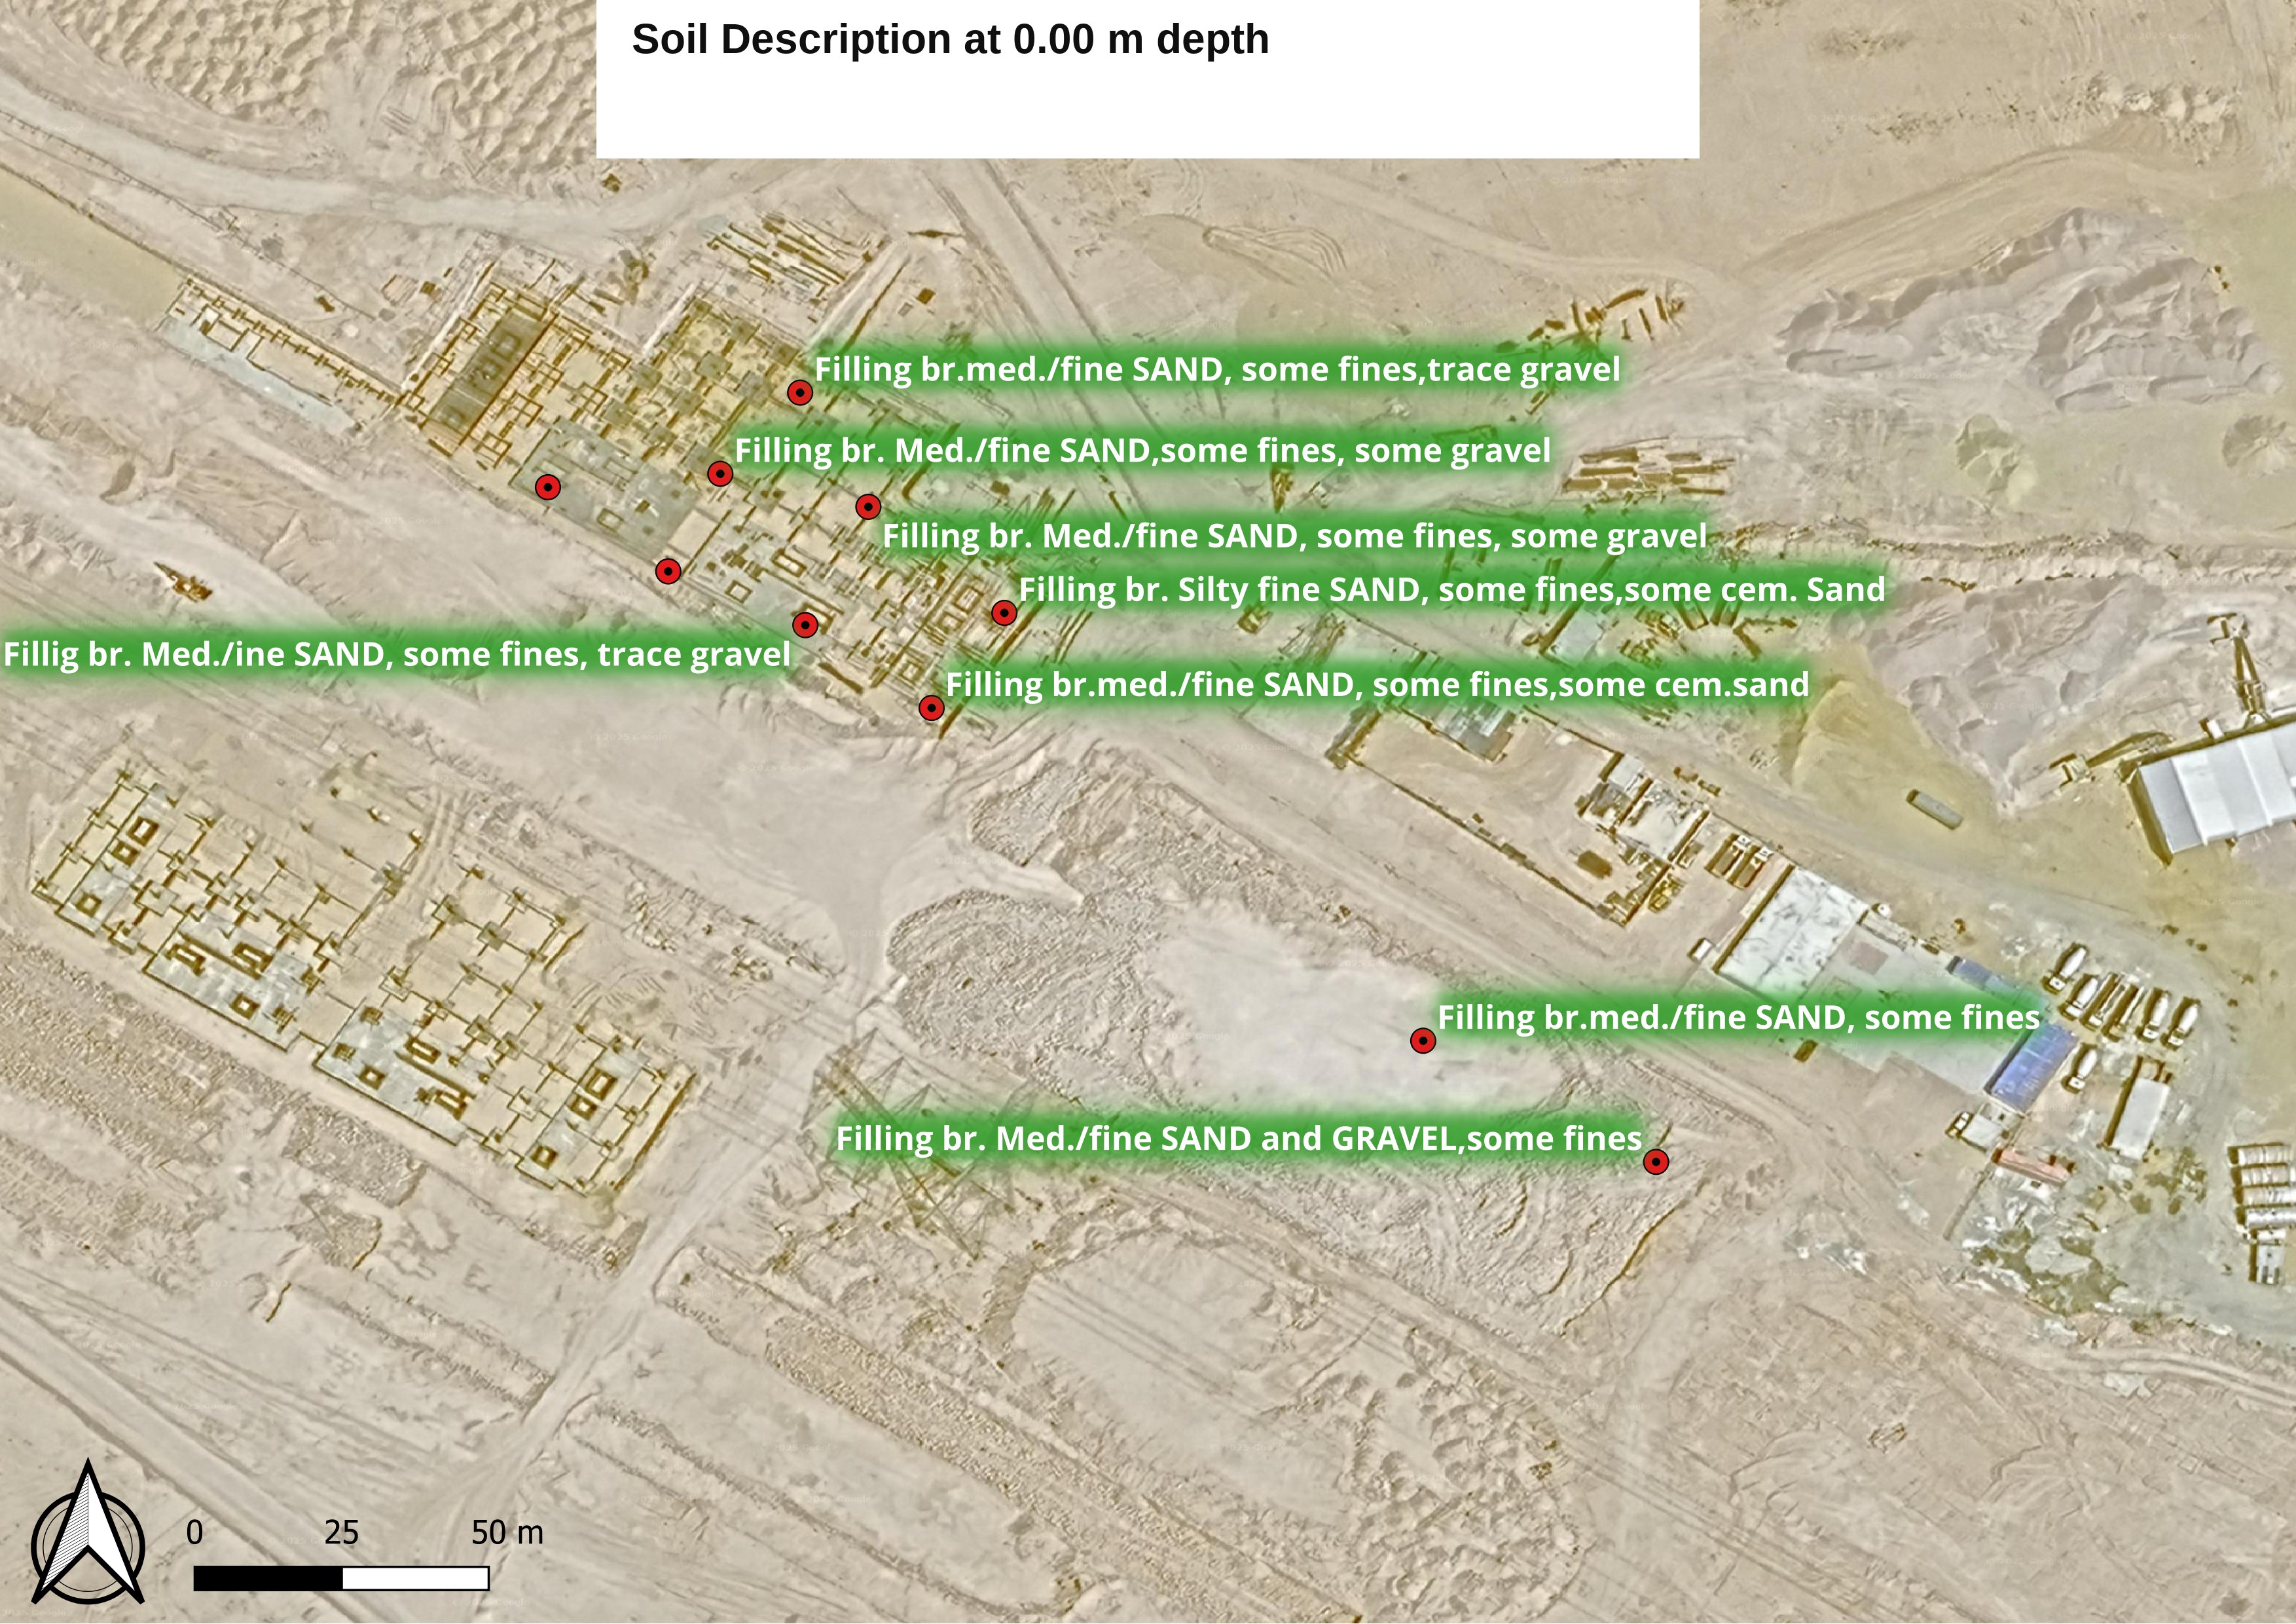
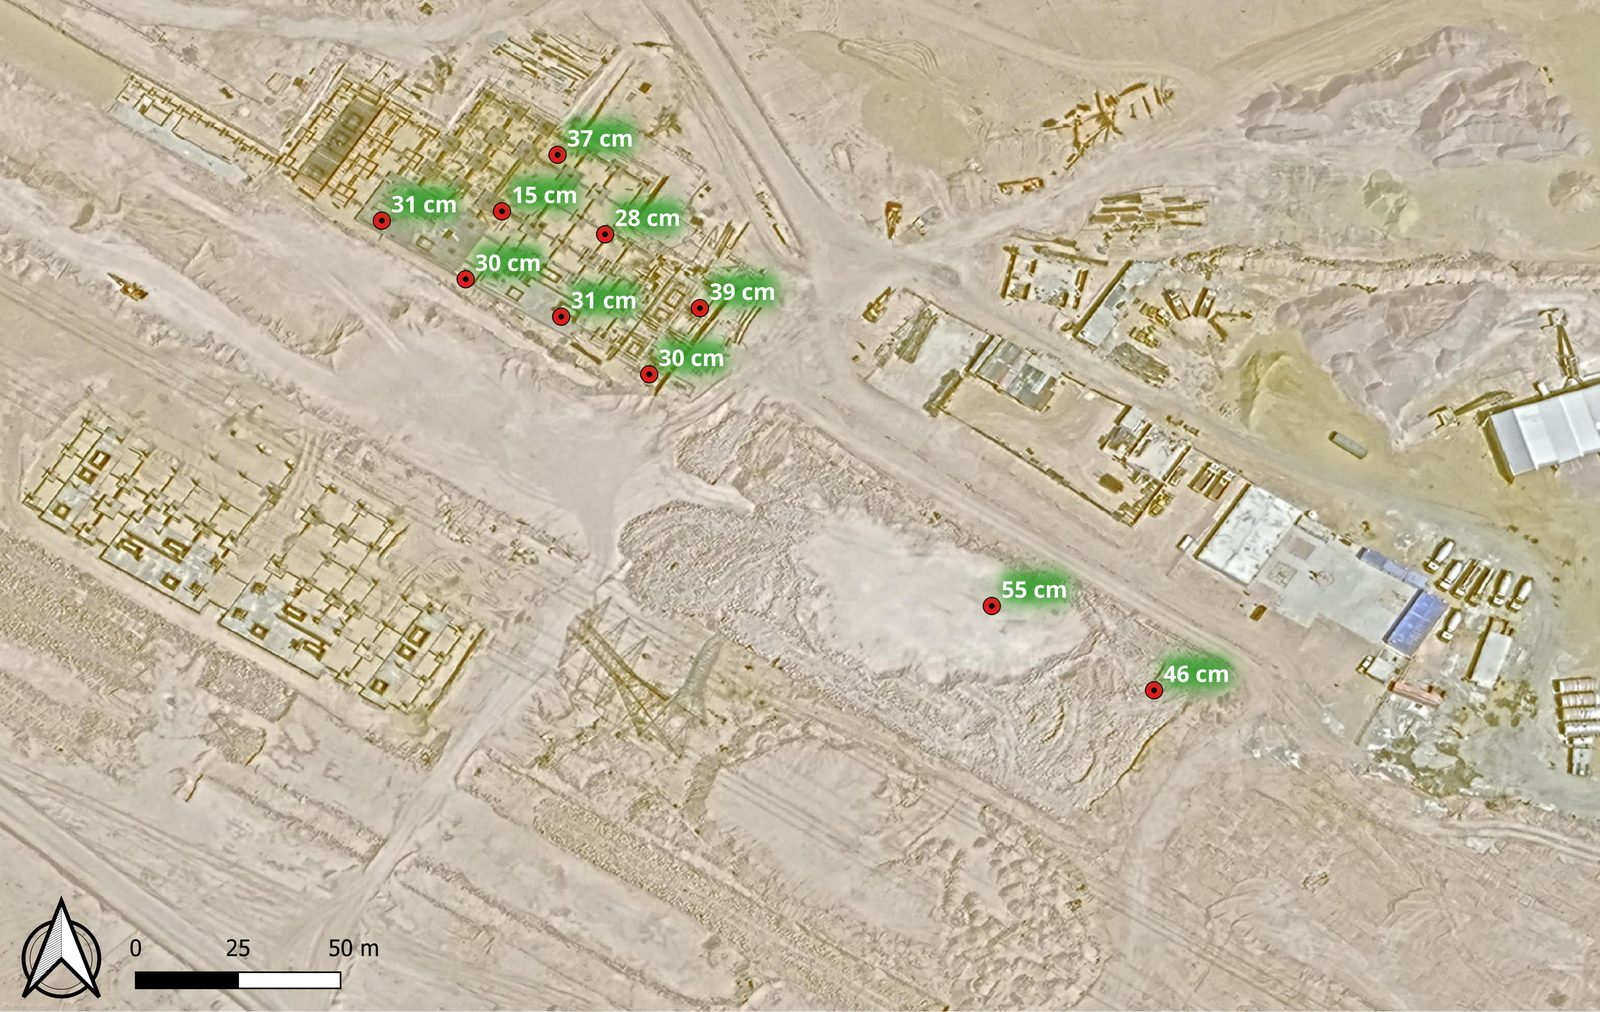
Each borehole is held as a point feature with an attribute table carrying its metadata and investigation results. Coverage can be validated across a site, subsurface information retrieved at any location, and the same dataset carried into downstream analysis.
Thematic mapping of soil test results
Test results mapped by depth, so variation across a site can be read spatially rather than borehole by borehole.
AGS 4.1 delivery
Data issued in AGS 4.1 format, compatible with client GIS and CAD systems alongside conventional reports.
Web GIS platform — in development
A browser-based viewer for borehole locations, test results and thematic map layers, currently in development.
Environmental monitoring
Wider environmental applications
The same satellite record extends beyond the investigation site — to corridors, coastlines and catchments where ground problems play out at a larger scale.
Six ground problems it answers
Large-area screening
Corridors and sites too big to walk line by line.
Remote & inaccessible ground
Terrain that is costly or unsafe to survey on foot.
Unknown surface conditions
First-pass ground character before mobilising rigs.
Coastal change
Shorelines, reclamation and low-lying margins that shift over time.
Drainage & flood pathways
Where water runs, ponds and erodes across a site.
Construction earthworks
Cut, fill and platform levels shaped by the terrain.
Ground-reading capabilities
Elevation & terrain modelling
Digital elevation models and derived products — slope, aspect, shaded relief.
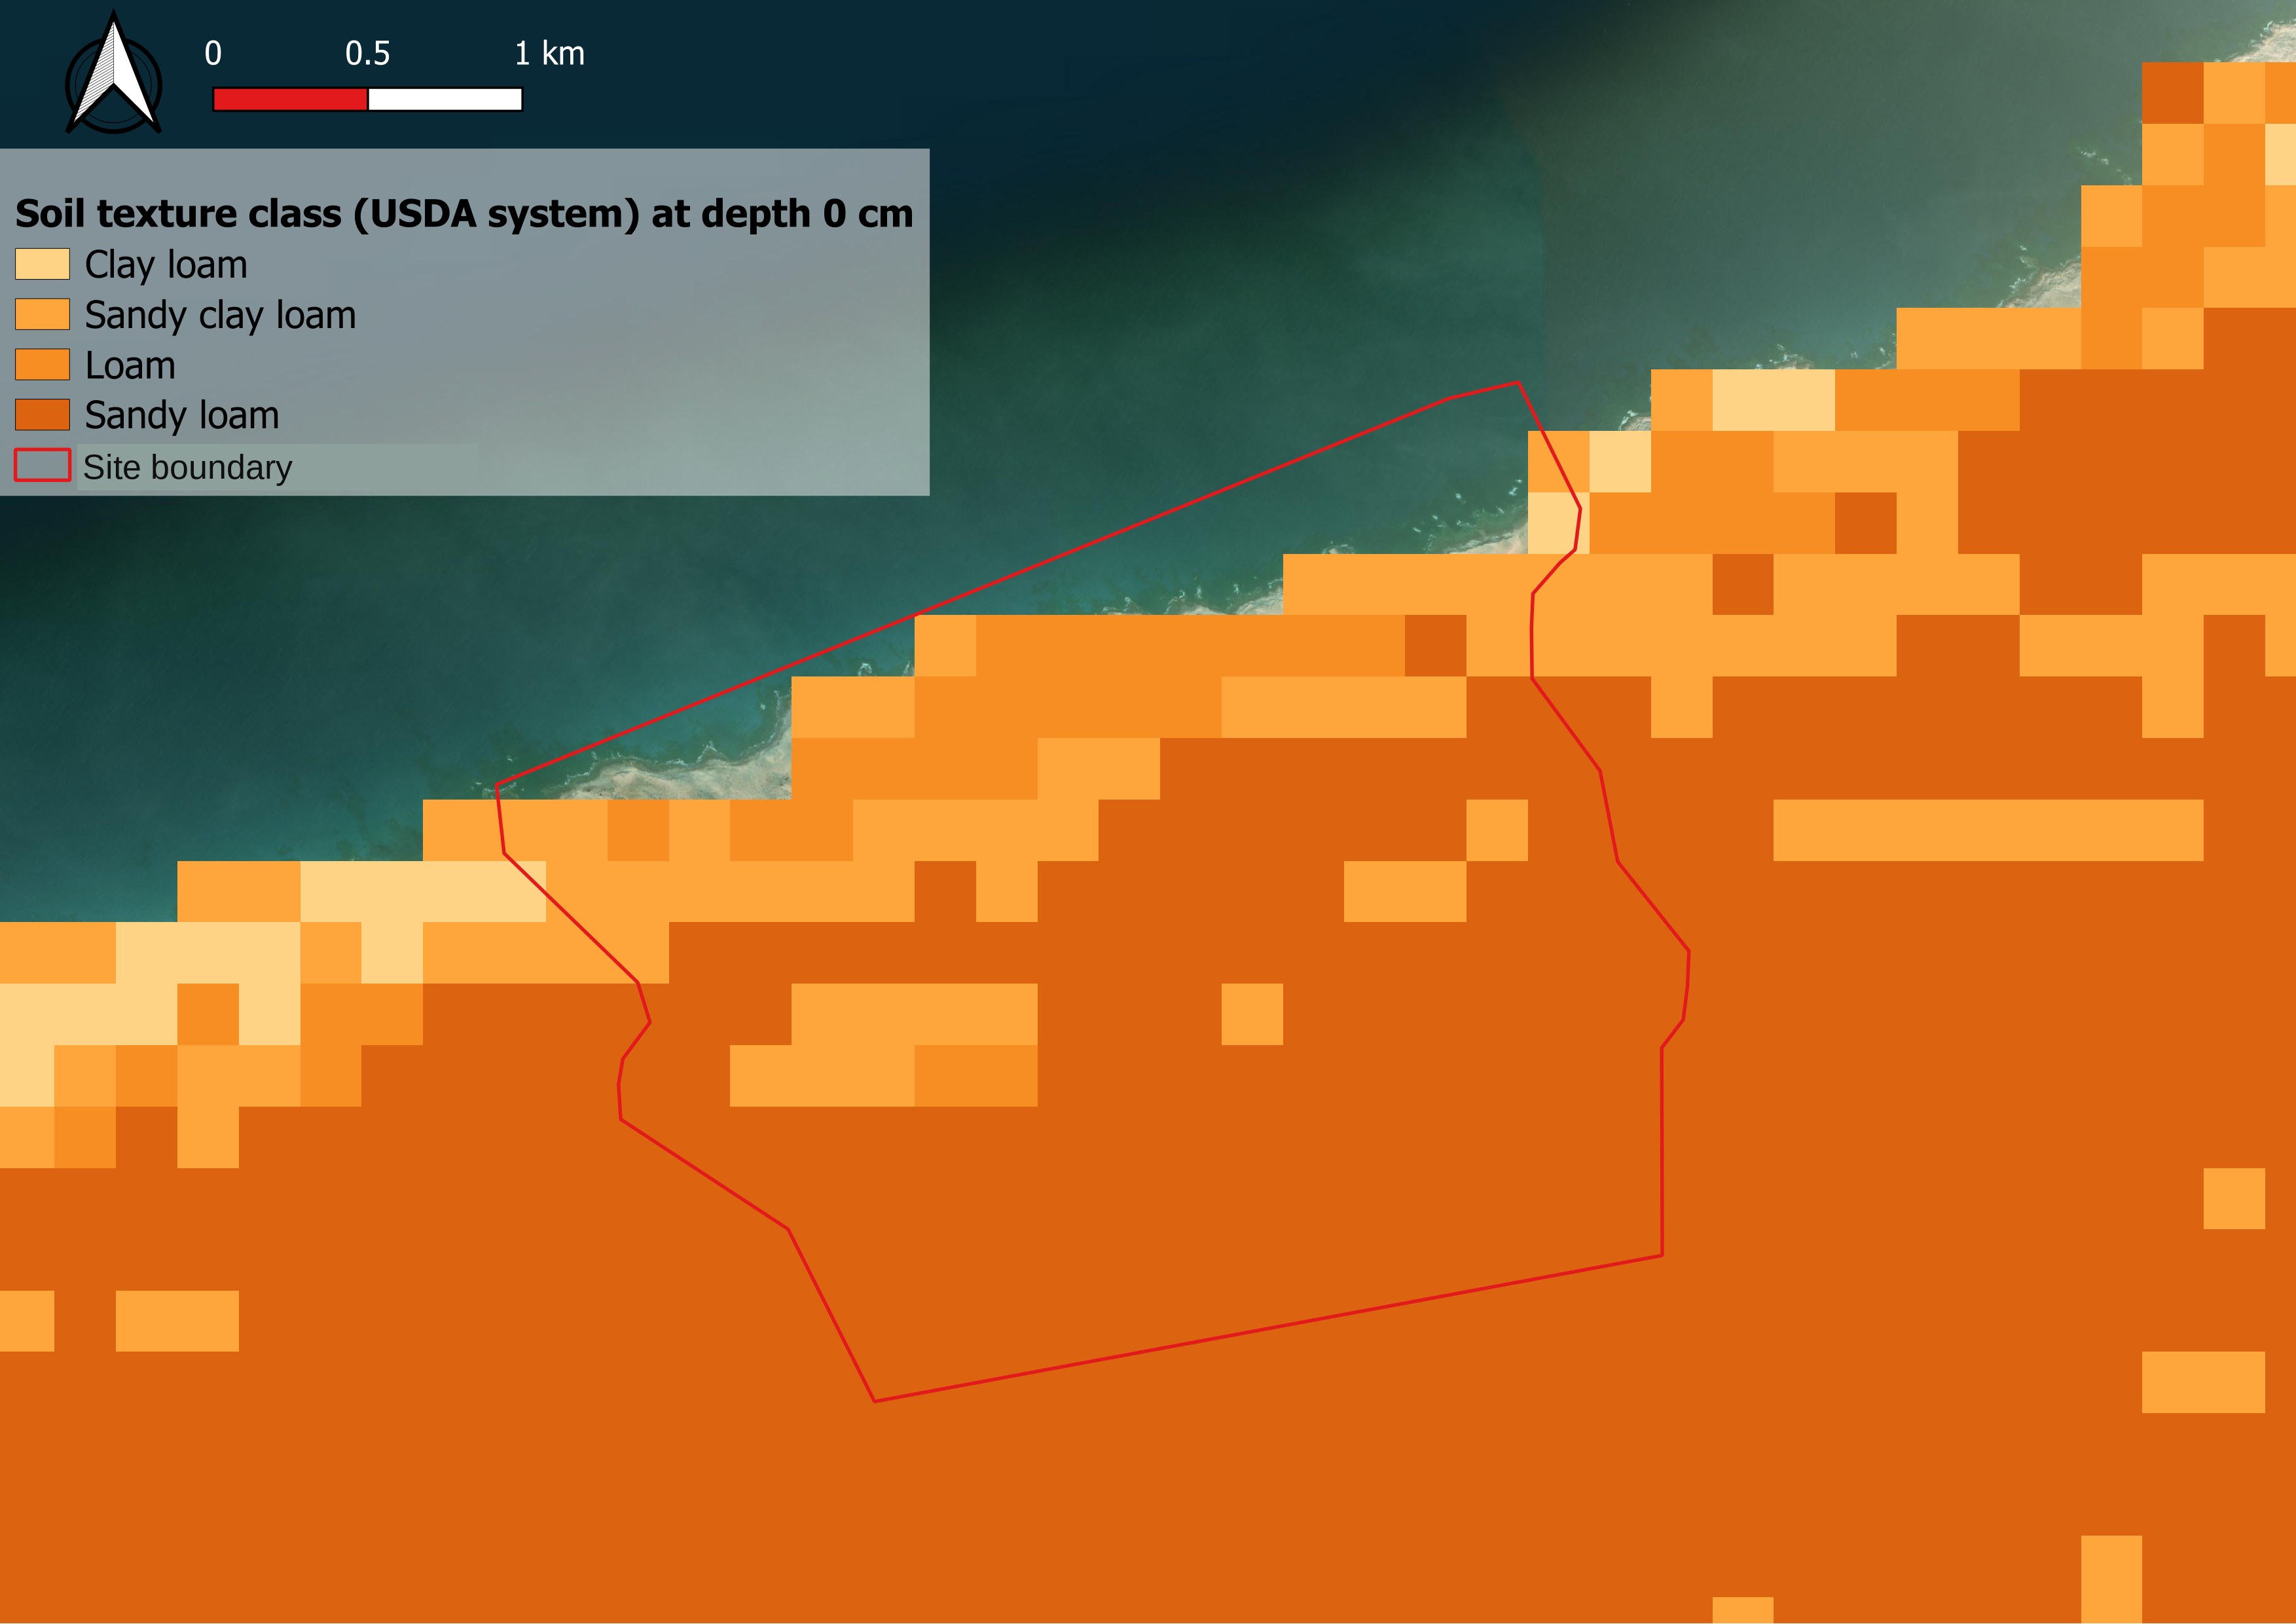
Surface texture & land cover mapping
Classifying ground surface character — rock, sand, sabkha, vegetation, made ground.
Drainage & catchment analysis
Flow paths, wadis and ponding areas traced from elevation data.
Ground change detection
Excavation, filling, reclamation and erosion tracked between satellite passes.
Ground deformation monitoring
Radar interferometry (InSAR) for millimetre-scale settlement and subsidence trends.
Investigation planning support
Borehole and trial pit layouts informed by mapped ground conditions.
Two products in detail
Terrain & Elevation Analysis
A ground model for any site or corridor, derived from satellite elevation data. Elevation, slope, aspect and shaded relief are produced as classified rasters, giving an engineering read of the terrain before anyone sets foot on site.
What value it brings
- Earlier understanding — terrain character known at desk-study stage, not after mobilisation.
- Better investigation design — boreholes and trial pits placed where the ground changes.
- Earthworks insight — gradients and drainage read directly for cut-and-fill planning.
- Coastal awareness — subtle low-lying gradients resolved where runoff and flooding matter.
Technical approach
- Copernicus DEM at 30 m resolution as the elevation base.
- Slope computed from elevation differences between neighbouring pixels, rise over run as a percentage.
- Aspect and shaded relief derived from the same raster.
- Classification into engineering-meaningful bands, from nearly level to very steep.
Expected outputs
- Classified elevation, slope, aspect and shaded relief rasters.
- Drainage and catchment maps.
- GIS-ready layers for client CAD and GIS systems.
Ground Surface & Change Monitoring
Repeat satellite passes are compared over time to map surface character and detect change — new excavation, filling, reclamation, erosion or encroachment — across areas far larger than any site visit can cover.
What value it brings
- Evidence of change — dated, repeatable records of what moved and where.
- Wide coverage — whole corridors or coastal stretches monitored in one pass.
- Early warning — deformation trends flagged before they become failures.
Technical approach
- Multispectral imagery classified into surface and land cover types.
- Image differencing between acquisition dates to isolate change.
- Radar interferometry for millimetre-scale vertical movement where required.
- Results screened by our geotechnical engineers for engineering significance.
Expected outputs
- Surface classification and land cover maps.
- Change maps with dated comparison.
- Deformation trend points and contours where InSAR is applied.
Benefits
Why it pays off
Desk-study readiness
Ground character known before mobilisation.
Focused fieldwork
Investigation effort concentrated where the ground changes.
Cost & time efficiency
Less reliance on extensive reconnaissance surveys; large areas covered consistently.
Long-term monitoring
Surface change and movement tracked over time using satellite archives.
Verifiable records
Dated, repeatable imagery supporting claims, compliance and reporting.
Scalability
Consistent insight from a single plot to a whole corridor or coastline.
Sample outputs
Real project outputs, anonymized
These are extracts from actual deliverables produced for a coastal development project. Client name, project name, coordinates and location identifiers have been removed — the data, classifications and mapping approach are exactly as delivered.
Land elevation (m) — 30 m DEM, coastal site Soil texture class (USDA) at 0 cm depth GIS borehole management — soil descriptions at 0.00 m
Engagement model
How to start
- 01
Submit an area of interest
Send us the site or corridor you want assessed.
- 02
Receive a demo
We generate terrain and ground outputs over a small sample area.
- 03
Review actionable insights
See the ground indicators derived for that area.
Send us an area of interest and we will return a sample output before any wider commitment.
Talk to our team